Monitoring with Prometheus, Loki, Grafana and Kubernetes. Part 5. kube-prometheus-stack
All pages
| Name | Summary |
|---|---|
| Monitoring with Prometheus, Loki, Grafana and Kubernetes. Part 1. Kubernetes cluster | Here is about basic configuration of Kubernetes monitoring cluster |
| Monitoring with Prometheus, Loki, Grafana and Kubernetes. Part 2. SNMP | Here is about SNMP O_O |
| Monitoring with Prometheus, Loki, Grafana and Kubernetes. Part 3. GitLab Agent | How to connect a Kubernetes cluster to GitLab |
| Monitoring with Prometheus, Loki, Grafana and Kubernetes. Part 4. Prometheus exporters | Exporting Prometheus metrics |
| Monitoring with Prometheus, Loki, Grafana and Kubernetes. Part 5. kube-prometheus-stack | Migration to kube-prometheus-stack |
In this part, I will migrate to kube-prometheus-stack. Instead of manually configured manifests for grafana, alertmanager, prometheus, I will start using helm charts.
Why is kube-prometheus-stack?
An alternative to kube-prometheus-stack is kube-prometheus. Both solutions are based on prometheus-operator. Prometheus-operator provides Kubernetes CRDs for managing Prometheus, Alertmanager and other components, and also manages Prometheus target configuration, providing an autodiscovery mechanism based on Kubernetes label queries.
kube-prometheus and kube-prometheus-stack are installed with a set of components:
- Prometheus Operator
- Prometheus Operator CRDs (Prometheus, ALertmanager, etc.)
- Prometheus exporters (node-exporter, kube-state-metrics)
- Grafana
- Collection of Grafana dashboards and Prometheus rules At the same time, kube-prometheus-stack uses collections of alerts and dashboards from kube-prometheus.
So why kube-prometheus-stack instead of kube-prometheus? Compiling and customizing manifests, based on prometheus-operator CRDs, in kube-prometheus is performed based on jsonnet templates, while kube-prometheus-stack uses helm chart templating for this. The configuration of the kube-prometheus-stack components is managed by passing values to the corresponding chart, which is a more familiar way of managing manifests in a kubernetes cluster.
Next, in the process of chart templates customizing, I will regularly refer to values.yaml and corresponding templates from templates directory
Why migrate to kube-prometheus-stack?
kube-prometheus-stack will help to solve the following tasks:
- kubernetes cluster components need to be monitored. I would like to use a solution with a built-in set of alerting rules and grafana dashboards for this.
- when changing the Prometheus configuration, perform a reload without restarting the Prometheus Pod
- when adding new components to the cluster, add targets to the Prometheus configuration automatically, not manually. Use Prometheus service discovery
- start using helm, because this is the standard for Kubernetes
- simplify cluster support for an engineer
Now I create the configuration file kube-prometheus-stack.yml and start the configuration of kube-prometheus-stack.
Expose Service objects
The first thing I would like to talk about is how to make kube-prometheus-stack components accessible from the outside.
To access the Prometheus, Grafana and Alertmanager interface, I have to expose the corresponding Service objects to the outside. For this task, kube-prometheus-stack allows you to configure an Ingress object for each of the instances using helm chart template. This will allow you to abandon the previously manually configured Ingress manifest (see Ingress manifest from Part 1) and simplify the ingress-nginx configuration process.
To configure the new Ingress from kube-prometheus-stack template, I will rewrite the necessary values from values.yaml for prometheus, grafana and alertmanager objects in kube-prometheus-stack.yml.
Prometheus
I want the prometheus interface to be accessible by /prometheus path (similar to the configuration from Part 1). To do this, you need to specify the DNS name of the host where nginx controller is available. For correct traffic routing, the DNS hostname must be specified here, not the host ip address. For example, for prometheus.domain.com:
prometheus:
  prometheusSpec:
    routePrefix: /prometheus
  ingress:
    enabled: true
    hosts:
      - prometheus.domain.com
Prometheus object will be started with the "--web.external-url=http://prometheus.domain.com/prometheus/", "--web.route-prefix=/prometheus" arguments and is available via nginx at https://prometheus.domain.com/prometheus(see externalUrl option from prometheus.yaml template and paths option from ingress.yaml template).
What if I don’t have DNS and I would like to have access to prometheus via nginx node ip? Hardcode the ExternalURL option:
prometheus:
  prometheusSpec:
    externalUrl: http://stable-kube-prometheus-sta-prometheus.default:9090/prometheus
    routePrefix: /prometheus
  ingress:
    enabled: true
As an externalUrl I have specified the DNS name of the prometheus Service object. It is associated with the kube-prometheus-stack helm release name and namespace specified during the installation process. For the name stable and default namespace - stable-kube-prometheus-sta-prometheus.default (see service.yaml template). You can check it via dnsutils (see Debugging DNS Resolution):
kubectl exec -i -t dnsutils -- nslookup stable-kube-prometheus-sta-prometheus.default

Server:		10.96.0.10
Address:	10.96.0.10#53

Name:	stable-kube-prometheus-sta-prometheus.default.svc.cluster.local
Address: 10.103.130.113
This option is suitable for a simple cluster or for a development cluster. Prometheus will be available as at https://192.168.49.2/prometheus, where 192.168.49.2 is the node address with nginx controller, and by DNS https://prometheus.domain.com/prometheus hostname, if the corresponding DNS record exists.
Alertmanager
alertmanager:
  alertmanagerSpec:
    routePrefix: /alertmanager
  ingress:
    enabled: true
By analogy with Prometheus, Alertmanager object will be launched with the “–web.external-url=http://stable-kube-prometheus-sta-alertmanager.default:9093”, “–web.route-prefix=/alertmanager” arguments(see alertmanager.yaml template). But unlike Prometheus, this is enough for Alertmanager to access the interface via nginx both by DNS hostname (node with nginx controller) and by ip address.
Grafana
grafana:
  ingress:
    enabled: true
Any other links will be addressed to grafana ClusterIP. Also grafana will be accesible by “/” root prefix
Ingress nginx controller
I used to have one Ingress object and one Ingress nginx controller. Now, after configuring Ingress using kube-prometheus-stack, I have 3 Ingress objects and 1 Ingress nginx controller. What’s difference here?
Ingress object is used to form the nginx controller configuration - nginx.conf. The number of Ingress manifests is not important when using a single nginx controller (detailed). You can view the final nginx configuration like this:
# get all pods from all namespaces
kubectl get pod -A

...
ingress-nginx   ingress-nginx-controller-5959f988fd-fvss9                1/1     Running     19 (5m11s ago)   8d
...

# run cat /etc/nginx/nginx.conf command for nginx controller pod
kubectl -n ingress-nginx exec ingress-nginx-controller-5959f988fd-fvss9 -- cat /etc/nginx/nginx.conf
I will also attach a useful link about “What if there are several nginx controllers?” - multiple Ingress controllers
Preparing the k8s production cluster for migration to kube-prometheus-stack
In my production cluster, the paths /, /prometheus, /alertmanager are already used to access active components. Therefore, in order to ensure smooth migration in the current production cluster on kube-prometheus-stack, I will make its components (grafana, prometheus, alertmanager) temporarily available via other paths. To do this, change the corresponding spec in kube-prometheus-stack.yml:
# kube-prometheus-stack.yml
prometheus:
  prometheusSpec:
    externalUrl: http://stable-kube-prometheus-sta-prometheus.default:9090/prom-operator-prometheus
    routePrefix: /prom-operator-prometheus
  ingress:
    pathType: ImplementationSpecific
    ingressClassName: nginx
    enabled: true
alertmanager:
  alertmanagerSpec:
    routePrefix: /prom-operator-alertmanager
  ingress:
    pathType: ImplementationSpecific
    ingressClassName: nginx
    enabled: true
grafana:
  ingress:
    pathType: ImplementationSpecific
    ingressClassName: nginx
    enabled: true
    path: /prom-operator-grafana
  grafana.ini:
    server:
      root_url: http://localhost:3000/prom-operator-grafana
      serve_from_sub_path: true
If Ingress configuration is simple for prometheus and alertmanager, then it’s a little more complicated for grafana. To make grafana available by subpath /grafana, you need to add additional parameters for grafana.ini to grafana chart. Learn more at grafana chart page, and also in this issue and in official documentation.
The changes in kube-prometheus-stack.yml are temporary, only for the migration period.
Prometheus exporters
Before installing kube-prometheus-stack, I would like to abandon the previously manually written manifests for prometheus exporters in favor of helm charts. The list of Prometheus community charts can be found here. For example, I will prepare a helm values file for the prometheus-snmp-exporter that was installed in k8s cluster earlier:
# prometheus-snmp-exporter.yaml
extraConfigmapMounts:
  - name: snmp-exporter-configmap
    mountPath: /etc/snmp_exporter
    configMap: snmp-exporter-config
    readOnly: true
    defaultMode: 420
serviceMonitor:
  enabled: true
  namespace: default
  selector:
    release: stable
    app: network
  interval: 2m
  scrapeTimeout: 60s
  relabelings:
    - sourceLabels: [__param_target]
      targetLabel: instance
  params:
    # if_mib module
    - name: switch-1
      target: 10.1.1.1
    - name: switch-2
      target: 10.1.1.2
      scrapeTimeout: 60s
    - name: switch-3
      target: 10.1.1.3
      scrapeTimeout: 60s
    # huawei_sw custom module
    - name: switch-1-huawei-sw
      target: 10.1.1.1
      module:
        - huawei_sw
      additionalMetricsRelabels:
          target: switch-1
    - name: switch-2-huawei-sw
      target: 10.1.1.2
      module:
        - huawei_sw
      additionalMetricsRelabels:
          target: switch-2
    - name: switch-3-huawei-sw
      target: 10.1.1.3
      module:
        - huawei_sw
      additionalMetricsRelabels:
          target: switch-3
prometheus-snmp-exporter will use the previously created ConfigMap with the configuration - snmp-exporter-configmap from Part 4 (see extraConfigmapMounts.name).
Additionally, I will prepare prometheus-blackbox-exporter.yaml values files for prometheus-blackbox-exporter , which allows blackbox probing of endpoints over HTTP, HTTPS, DNS, TCP, ICMP and gRPC:
# prometheus-blackbox.exporter.yaml
config:
  modules:
    http_2xx:
      prober: http
      timeout: 5s
      http:
        valid_http_versions: ["HTTP/1.1", "HTTP/2.0"]
        follow_redirects: true
        preferred_ip_protocol: "ip4"
    icmp:
      prober: icmp
      timeout: 5s
      icmp:
        preferred_ip_protocol: "ip4"
serviceMonitor:
  enabled: true
  defaults:
    labels:
      release: stable
  targets:
    - name: server
      url: http://192.168.0.10
      interval: 60s
      scrapeTimeout: 60s
    - name: switch-1
      url: 10.1.1.1
      interval: 60s
      scrapeTimeout: 60s
      module: icmp
prometheus-snmp-exporter and prometheus-blackbox-exporter helm charts allow you to configure ServiceMonitor objects and provide Prometheus Service Discovery (check it with kubectl get servicemonitor command). But what if there is no helm chart for the exporter or the chart does not provide for the creation of ServiceMonitor objects? What if the exporter is installed outside the cluster? For these scenarios in kube-prometheus-stack, it is possible to add Prometheus targets manually using additionalScrapeConfigs: option. I’ll do it for MKTXP and Node Exporter, which I installed in Part 4:
# here is a part of kube-prometheus-stack.yml configuration
# just for MKTXP and Node Exporter static_configs
# prometheus
prometheus:
  prometheusSpec:
    externalUrl: http://stable-kube-prometheus-sta-prometheus.default:9090/prometheus
    routePrefix: /prometheus
    additionalScrapeConfigs:
      - job_name: 'node-exporter'
        static_configs:
          - targets:
            - '192.168.0.10:9100'
      - job_name: 'mktxp-exporter'
        scrape_interval: 3m
        scrape_timeout: 1m
        static_configs:
          - targets:
            - 'mktxp-exporter-cluster-ip-service.default.svc.cluster.local:49090'
Now that the values files for kube-prometheus-stack and exporters are ready, I will configure a GitLab pipeline, with which I will install it into an existing production cluster.
GitLab pipeline
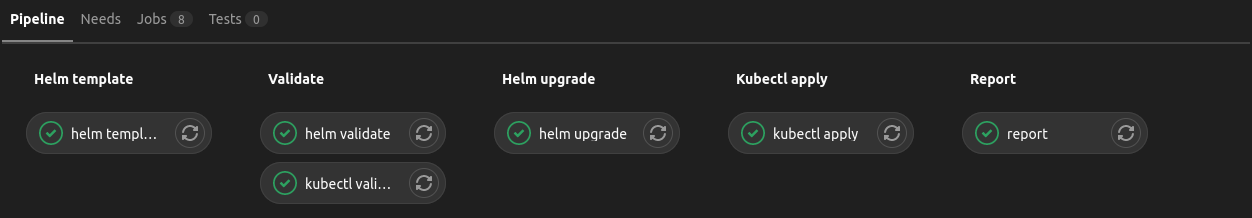
Since before I did not allocate each component to a separate job and applied manifests recursively, then I will also use one job to update/install all helm charts. Because each helm upgrade or helm install requires a release name and a chart, so it will not work to run the command recursively in the directory with charts. The pipeline can be logically divided into 3 parts:
- processing of the helm manifests:
- creating of the templates (
helm templatejob) - validation of the manifests, just for example, using
kubeconform, is performed on the validate stage (helm validatejob) - upgrade or installation of manifests in the k8s cluster (
helm upgradejob)
- creating of the templates (
- processing of the manually created manifests:
- validation of the manifests, just for example, using kubeconform, is performed on validate stage (
kubectl validatejob) - installation of the manifests in the k8s cluster (
kubectl applyjob)
- validation of the manifests, just for example, using kubeconform, is performed on validate stage (
- checking the status of k8s objects (
reportjob)
stages:
    - helm template
    - validate
    - helm upgrade
    - kubectl apply
    - report

default:
  tags:
    - docker

.kubectl_before_script: &kubectl_before_script
  before_script:
    - kubectl config get-contexts
    - kubectl config get-clusters
    - kubectl config set-cluster gitlab --certificate-authority="$KAS_CA"
    - if [ -n "$KUBE_CONTEXT" ]; then kubectl config use-context "$KUBE_CONTEXT"; fi

.helm_before_script: &helm_before_script
  before_script:
    - helm version
    - helm repo add prometheus-community https://prometheus-community.github.io/helm-charts
    - helm repo update

variables:
  KUBE_CONTEXT: shpe/monitoring:monitoring
  KUBE_PROM_STACK_RELEASE_NAME: stable
  KUBE_PROM_STACK_CHART: kube-prometheus-stack
  KUBE_PROM_STACK_VALUES: kube-prometheus-stack
  HELM_RELEASE_NAMES: prometheus-blackbox-exporter prometheus-snmp-exporter
  GREEN_TXT_COLOR: '\e[32m'
  CLEAR_TXT_COLOR: '\e[0m'

# helm template
# except kube-prometheus-stack
helm template:
  stage: helm template
  image:
    name: alpine/helm
    entrypoint: [""]
  <<: *helm_before_script
  script:
    - |
      for RELEASE_NAME in $HELM_RELEASE_NAMES
        do
          echo -e "${GREEN_TXT_COLOR}helm template --output-dir templates ${RELEASE_NAME} prometheus-community/${RELEASE_NAME} -f ${RELEASE_NAME}.yml${CLEAR_TXT_COLOR}"
          helm template --output-dir templates ${RELEASE_NAME} prometheus-community/${RELEASE_NAME} -f ${RELEASE_NAME}.yml
        done
  artifacts:
    paths:
      - templates/

# helm validate
# except kube-prometheus-stack
helm validate:
  stage: validate
  image:
    name: ghcr.io/yannh/kubeconform:latest-alpine
    entrypoint: [""]
  before_script:
    - ''
  script:
    - |
      for RELEASE_NAME in $HELM_RELEASE_NAMES
        do
          echo -e "${GREEN_TXT_COLOR}~/../kubeconform templates/${RELEASE_NAME}${CLEAR_TXT_COLOR}"
          ~/../kubeconform -ignore-missing-schemas templates/${RELEASE_NAME}
        done

# helm upgrade or install
helm upgrade:
  stage: helm upgrade
  image:
    name: alpine/helm
    entrypoint: [""]
  <<: *helm_before_script
  script:
    # upgrade kube-prometheus-stack
    - helm --kube-ca-file=$KAS_CA --kube-context=$KUBE_CONTEXT upgrade --install --reuse-values --no-hooks ${KUBE_PROM_STACK_RELEASE_NAME} prometheus-community/${KUBE_PROM_STACK_CHART} -f ${KUBE_PROM_STACK_VALUES}.yml
    # upgrade other helm releases
    - |
      for RELEASE_NAME in $HELM_RELEASE_NAMES
        do
          echo -e "${GREEN_TXT_COLOR}Upgrade or install ${RELEASE_NAME} with helm${CLEAR_TXT_COLOR}"
          echo -e "${GREEN_TXT_COLOR}helm --kube-ca-file=$KAS_CA --kube-context=$KUBE_CONTEXT upgrade --install --reuse-values --no-hooks ${RELEASE_NAME} prometheus-community/${RELEASE_NAME} -f ${RELEASE_NAME}.yml${CLEAR_TXT_COLOR}"
          helm --kube-ca-file=$KAS_CA --kube-context=$KUBE_CONTEXT upgrade --install --reuse-values --no-hooks ${RELEASE_NAME} prometheus-community/${RELEASE_NAME} -f ${RELEASE_NAME}.yml
        done

# kubectl validate
kubectl validate:
  stage: validate
  image:
    name: ghcr.io/yannh/kubeconform:latest-alpine
    entrypoint: [""]
  before_script:
    - ''
  script:
  - ~/../kubeconform -ignore-missing-schemas ./manifests/

# kubectl apply
# manually configured manifests
kubectl apply:
  stage: kubectl apply
  <<: *kubectl_before_script
  image:
    name: bitnami/kubectl:latest
    entrypoint: [""]
  script:
  - kubectl apply -R -f ./manifests

# check the status of k8s objects
report:
  stage: report
  <<: *kubectl_before_script
  image:
    name: bitnami/kubectl:latest
    entrypoint: [""]
  script:
  - kubectl get statefulset,deployment,pod -A
  - kubectl get svc,endpoints -A
  - kubectl get cm -A
  - kubectl get pv,pvc -A
  - kubectl get secrets -A
  # get crds
  - kubectl get prometheus,alertmanager,servicemonitor -A
  - kubectl events -A
Now it is enough to run the written pipeline and check the availability of kube-prometheus-stack components on the production cluster. For example, for prometheus - http://192.168.49.2/prom-operator-prometheus.
Prometheus rule and Grafana dashboards
kube-prometheus-stack, by default, is installed with a set of prometheus rules and grafana dashboards. kube-prometheus-stack does not store rules and dashboards, but generates them using scripts from hack folder and uses kube-prometheus manifests and other sources. Detailed.
Each script, sync_grafana_dashboards.py and sync_prometheus_rules.py , from hack folder, contains a source files list with manifests. You can see that PrometheusRule crd is used to describe prometheus rules, and ConfigMap is used to describe grafana dashboards. These Prometheus rules and Grafana dashboards can be managed in kube-prometheus-stack using values.yaml(see .Values.defaultRules and .Values.grafana.defaultDashboardsEnabled).
Prometheus rules migration
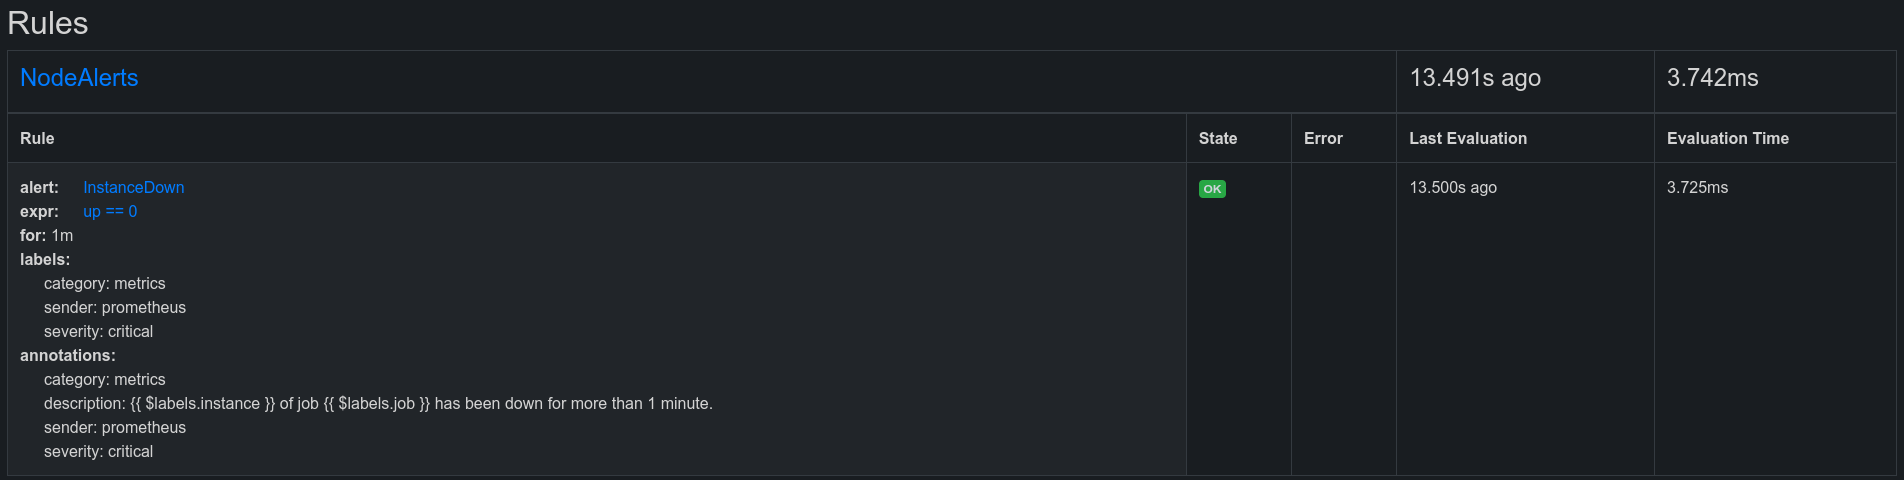
To add custom prometheus recording or alerting rules, you don’t need to edit the previously described manifests. To do this, just add the rules to .Values.additionalPrometheusRulesMap. For example, I will add the alerting rule for node exporter to my kube-prometheus-stack.yml:
# prometheus rules
additionalPrometheusRulesMap:
  # PrometheusRule object name
  node-exporter-test-alerting-rules:
    groups:
      # name of the group with rules
      - name: NodeAlerts
        rules:
        - alert: InstanceDown
          expr: up == 0
          for: 1m
          labels:
            severity: critical
            sender: prometheus
            category: metrics
            # this label will be used by the alertmanager to create a template
            message_type: short
          annotations:
            description: ' of job  has been down for more than 1 minute.'
            severity: critical
            sender: prometheus
            category: metrics
In the prometheus interface it will look like this:
Migration of grafana dashboards and grafana datasources
To add a dashboard or datasource to grafana, you need to create a ConfigMap or Secret with the appropriate label, grafana_dashboard: "1" for dashboards and grafana_datasource: "1" for datasources. For example:
# some dashboard
apiVersion: v1
data:
  some-dashboard.json: |
    RAW_JSON
kind: ConfigMap
metadata:
  labels:
    grafana_dashboard: "1"
# some datasource
apiVersion: v1
data:
  some-datasource.yaml: |
    RAW_YAML
kind: ConfigMap
metadata:
  labels:
    grafana_datasource: "1"
How does it works?
kube-prometheus-stack uses grafana subchart for grafana configuration. Grafana subchart, by default, will deploy to the Pod from Grafana special quay.io/kiwigrid/k8s-sidecar sidecar container (see .Values.sidecar.image from grafana values.yaml file), that collect the configmaps with specified label and stores the included files them into the respective folders. These folders are kubernetes emptyDir volumes, which are mounted both in a sidecar container and in a container with grafana. For dashboards it is /tmp/dashboards, for datasources it is /etc/grafana/provisioning/datasources. When there are changes in these directories, sidecar container sends an http post to grafana to update the configuration of dashboards and datasources.
Grafana updates the configuration using provision dashboards and data sources feature. For provisioning of dashboards, dashboard provider config is mounted in a container with grafana file. It points to the directory for provisioning:
# open bash in grafana pod
$ kubectl exec -it stable-grafana-769bdfb95f-x5l7x -- sh

# check provider config file for dashboards
/usr/share/grafana $ cat /etc/grafana/provisioning/dashboards/sc-dashboardproviders.yaml
apiVersion: 1
providers:
  - name: 'sidecarProvider'
    orgId: 1
    folder: ''
    type: file
    disableDeletion: false
    allowUiUpdates: false
    updateIntervalSeconds: 30
    options:
      foldersFromFilesStructure: false
      path: /tmp/dashboards
All json files from ConfigMaps with the grafana_dashboard: "1" label will be added to /tmp/dashboards. Grafana will find them and create new dashboards.
For datasource provisioning grafana checks the /etc/grafana/provisioning/datasources directory:
# open bash in grafana pod
$ kubectl exec -it stable-grafana-769bdfb95f-x5l7x -- sh

# check data sources config file
/usr/share/grafana $ cat /etc/grafana/provisioning/datasources/datasource.yaml
apiVersion: 1
datasources:
- name: Prometheus
  type: prometheus
  uid: prometheus
  url: http://stable-kube-prometheus-sta-prometheus.default:9090/prom-operator-prometheus
  access: proxy
  isDefault: true
  jsonData:
    httpMethod: POST
    timeInterval: 30s
- name: Alertmanager
  type: alertmanager
  uid: alertmanager
  url: http://stable-kube-prometheus-sta-alertmanager.default:9093/prom-operator-alertmanager
  access: proxy
  jsonData:
    handleGrafanaManagedAlerts: false
By default, kube-prometheus-stack creates a datasource.yaml file for prometheus and alertmanager only. All yaml files created from ConfigMaps with grafana_datasource: "1" label will be added to /etc/grafana/provisioning/datasources/. Grafana will find them and create new datasources.
Now I will copy the previously created snmp dashboard and add loki datasource. For snmp dashboard migration:
- open
SNMP statsdashboard in Grafana web UI - click
Dashboard settings-JSON Model-Copy - create a ConfigMap in the repository, for example,
monitoring/manifests/grafana/dashboards/snmp-stats.yamlwith the following content:apiVersion: v1 kind: ConfigMap metadata: annotations: meta.helm.sh/release-name: stable meta.helm.sh/release-namespace: default labels: grafana_dashboard: "1" release: stable name: snmp-stats namespace: default data: snmp-stats.json: |- ## here is copied dashboard JSON Model - commit to the cluster repository:
git add . git commit -m "Add SNMP stats dashboard to grafana" git push origin main - the dashboard will appear in the Grafana web UI after the pipeline has completed all the jobs
Now I will add an existing loki deployment(see Part 1 to the grafana datasource list:
- create a ConfigMap in the repository, for example,
monitoring/manifests/grafana/datasources/loki.yamlwith the following content:apiVersion: v1 data: loki.yaml: |- apiVersion: 1 datasources: - name: Loki type: loki uid: loki url: http://loki-cluster-ip-service.default.svc.cluster.local:3100/ access: proxy isDefault: false kind: ConfigMap metadata: annotations: meta.helm.sh/release-name: stable meta.helm.sh/release-namespace: default labels: app: kube-prometheus-stack-grafana app.kubernetes.io/instance: stable app.kubernetes.io/managed-by: Helm app.kubernetes.io/part-of: kube-prometheus-stack grafana_datasource: "1" heritage: Helm release: stable name: stable-kube-prometheus-sta-grafana-loki-datasource namespace: default - commit to the cluster repository:
git add . git commit -m "Add Loki datasource to grafana" git push origin main - the loki datasource will appear in the Grafana web UI after the pipeline has completed all the jobs
By default, grafana helm chart creates emptyDir volumes to store grafana dashboards and datasources. emptyDir is not a permanent storage and restarting the deployment object will result in data loss. But the approach described above for creating dashboards and datasources using ConfigMap objects will avoid this. This solution is great for both a single node cluster and a cluster with a large number of nodes (in this case, to achieve availability, the number of replicas must be > 1). It also corresponds to the Configurations as Code approach, and the repository performs an additional role of a repository of configuration data.
But what if you want to create dashboards and datasources from Grafana web UI? You can enable persistence in grafana helm values file using Persistent Volume Claim (PVC). A good recommendation in this case is to use an external Grafana database.
Useful links:
- https://github.com/prometheus-community/helm-charts/issues/1370
- https://grafana.com/tutorials/provision-dashboards-and-data-sources/
Alertmanager configuration
If grafana helm chart is in the kube-prometheus-stack dependency list, then alertmanager helm chart is not there (see dependencies. kube-prometheus-stack uses Alertmanager crd instead of alertmanager helm chart, so to configure alertmanager, you need to use only kube-prometheus-stack values file.
I will send alerting notifications to telegram, just for example. I will create a telegram chat and add a bot there to send notifications, I will need chat_id, bot_token (here without “How to”. You can google the instructions).
Now I will configure alertmanager to send notifications. I will create 2 templates describing the format of the message sent to telegram, long message and short message. The first one will be used by default and provide maximum information from prometheus labels. The second will have a short format and provide an opportunity to specify additional information manually using annotations.
Taking into account the previously configured options, the alertmanager configuration in the kube-prometheus-stack.the yaml file will look like this(a description of the configured options can be found in the official documentation):
alertmanager:
  alertmanagerSpec:
    routePrefix: /prom-operator-alertmanager
  ingress:
    pathType: ImplementationSpecific
    ingressClassName: nginx
    enabled: true
  config:
    route:
      receiver: 'telegram-default-long-receiver'
      group_by: ['...']
      group_wait: 30s
      group_interval: 1m
      repeat_interval: 4h
      routes:
      - receiver: 'telegram-short-receiver'
        matchers:
        - message_type = "short"
      # Note that you must specify null receiver,
      # since it is defined in the default configuration file
      - receiver: 'null'
        matchers:
        - alertname =~ ".*Null"
    receivers:
    - name: 'telegram-default-long-receiver'
      telegram_configs:
      - send_resolved: true
        bot_token: 'your_bot_token'
        api_url: 'https://api.telegram.org'
        chat_id: your_chat_id
        parse_mode: 'HTML'
        message: ''
    - name: 'telegram-short-receiver'
      telegram_configs:
      - send_resolved: true
        bot_token: 'your_bot_token'
        api_url: 'https://api.telegram.org'
        chat_id: your_chat_id
        parse_mode: 'HTML'
        message: ''
    - name: 'null'
  templateFiles:
    telegram-default-long-template.tmpl: |-
      # see "telegram-default-long-template.tmpl" file
      # https://github.com/timeforplanb123/timeforplanb123.github.io/blob/master/_posts/telegram-default-long-template.tmpl
      # and copypaste it here
    telegram-short-template.tmpl: |-
      # see "telegram-short-template.tmpl" file
      # https://github.com/timeforplanb123/timeforplanb123.github.io/blob/master/_posts/telegram-short-template.tmpl
      # and copypaste it here
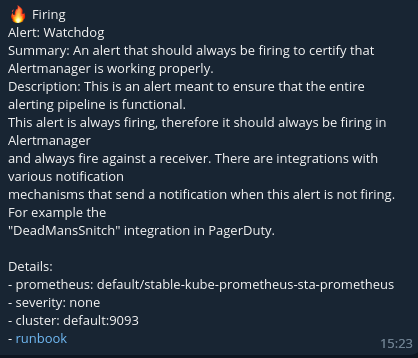
Since kube-prometheus-stack is installed with a set of prometheus alerting rules (see above), then after updating the configuration, you can see alerting notifications in telegram chat, for example, a message about the correct operation of Alertmanager, formatted using the telegram-default-long-template.tmpl template:
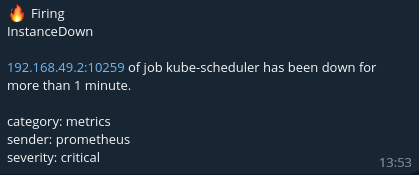
A message formatted using the telegram-short-template.tmpl template will look, for example, like this:
To work with Alertmanager, kube-prometheus-stack creates StatefulSet workload object. It contains Pod with quay.io/prometheus/alertmanager and quay.io/prometheus-operator/prometheus-config-reloader containers:
$ kubectl get statefulset
NAME                                                   READY   AGE
alertmanager-stable-kube-prometheus-sta-alertmanager   1/1     17h
...

$ kubectl get pod
NAME                                                     READY   STATUS    RESTARTS         AGE
alertmanager-stable-kube-prometheus-sta-alertmanager-0   2/2     Running   0                17h
...

$ kubectl describe statefulset alertmanager-stable-kube-prometheus-sta-alertmanager
...
Containers:
   alertmanager:
    Image:       quay.io/prometheus/alertmanager:v0.25.0
   ...
   config-reloader:
    Image:       quay.io/prometheus-operator/prometheus-config-reloader:v0.66.0
   ...
Similarly to Prometheus, prometheus-config-reloader monitors Alertmanager configuration files and sends an HTTP POST request to the /-/reload Alertmanager endpoint for any changes, which allows updating the Alertmanager configuration without restarting workload.
To store the configuration, Alertmanager uses Secret objects:
$ kubectl get secret
NAME                                                                TYPE                 DATA   AGE
alertmanager-stable-kube-prometheus-sta-alertmanager                Opaque               3      17h
alertmanager-stable-kube-prometheus-sta-alertmanager-generated      Opaque               3      17h
alertmanager-stable-kube-prometheus-sta-alertmanager-tls-assets-0   Opaque               0      17h
alertmanager-stable-kube-prometheus-sta-alertmanager-web-config     Opaque               1      17h
...
Using kubectl describe you can see where these Secrets are mounted:
$ kubectl describe statefulset alertmanager-stable-kube-prometheus-sta-alertmanager
...
Mounts:
      /alertmanager from alertmanager-stable-kube-prometheus-sta-alertmanager-db (rw)
      /etc/alertmanager/certs from tls-assets (ro)
      /etc/alertmanager/config from config-volume (rw)
      /etc/alertmanager/config_out from config-out (ro)
      /etc/alertmanager/web_config/web-config.yaml from web-config (ro,path="web-config.yaml")
...
or check statefulset object configuration with kubectl edit:
$ kubectl edit statefulset alertmanager-stable-kube-prometheus-sta-alertmanager
...
      volumes:
      - name: config-volume
        secret:
          defaultMode: 420
          secretName: alertmanager-stable-kube-prometheus-sta-alertmanager-generated
      - name: tls-assets
        projected:
          defaultMode: 420
          sources:
          - secret:
              name: alertmanager-stable-kube-prometheus-sta-alertmanager-tls-assets-0
      - emptyDir:
          medium: Memory
        name: config-out
      - name: web-config
        secret:
          defaultMode: 420
          secretName: alertmanager-stable-kube-prometheus-sta-alertmanager-web-config
      - emptyDir: {}
        name: alertmanager-stable-kube-prometheus-sta-alertmanager-db
...
       volumeMounts:
        - mountPath: /etc/alertmanager/config
          name: config-volume
        - mountPath: /etc/alertmanager/config_out
          name: config-out
          readOnly: true
        - mountPath: /etc/alertmanager/certs
          name: tls-assets
          readOnly: true
        - mountPath: /alertmanager
          name: alertmanager-stable-kube-prometheus-sta-alertmanager-db
        - mountPath: /etc/alertmanager/web_config/web-config.yaml
          name: web-config
          readOnly: true
          subPath: web-config.yaml
...
The final configuration and alerting templates can be checked in the corresponding Pod:
$ kubectl get pod
NAME                                                     READY   STATUS    RESTARTS         AGE
alertmanager-stable-kube-prometheus-sta-alertmanager-0   2/2     Running   0                18h
...

$ kubectl exec -it alertmanager-stable-kube-prometheus-sta-alertmanager-0 -- sh
/alertmanager $ ls /etc/alertmanager/
alertmanager.yml  certs             config            config_out        web_config

/alertmanager $ ls /etc/alertmanager/config
alertmanager.yaml.gz                 telegram-short-template.tmpl
telegram-default-long-template.tmpl

/alertmanager $ cat /etc/alertmanager/config/telegram-short-template.tmpl

...
Conclusion
After transferring all prometheus rules and grafana dashboards, it remains only to change temporary ingress paths for grafana, prometheus, alertmanager from kube-prometheus-stack to permanent ones and delete unused kubernetes objects. Final kube-prometheus-stack.yml with permanent ingress paths:
# prometheus rules
additionalPrometheusRulesMap:
  node-exporter-test-alerting-rules:
    groups:
      - name: NodeAlerts
        rules:
        - alert: InstanceDown
          expr: up == 0
          for: 1m
          labels:
            severity: critical
            sender: prometheus
            category: metrics
            custom: custom
            message_type: short
          annotations:
            description: ' of job  has been down for more than 1 minute.'
            severity: critical
            sender: prometheus
            category: metrics
# prometheus
prometheus:
  prometheusSpec:
    externalUrl: http://stable-kube-prometheus-sta-prometheus.default:9090/prometheus
    routePrefix: /prometheus
    additionalScrapeConfigs:
      - job_name: 'node-exporter'
        static_configs:
          - targets:
            - '192.168.0.10:9100'
      - job_name: 'mktxp-exporter'
        scrape_interval: 3m
        scrape_timeout: 1m
        static_configs:
          - targets:
            - 'mktxp-exporter-cluster-ip-service.default.svc.cluster.local:49090'
  ingress:
    pathType: ImplementationSpecific
    ingressClassName: nginx
    enabled: true
# grafana
grafana:
  ingress:
    pathType: ImplementationSpecific
    ingressClassName: nginx
    enabled: true
    path: /
  grafana.ini:
    server:
      root_url: http://localhost:3000/
# alertmanager
alertmanager:
  alertmanagerSpec:
    routePrefix: /prom-operator-alertmanager
  ingress:
    pathType: ImplementationSpecific
    ingressClassName: nginx
    enabled: true
  config:
    route:
      receiver: 'telegram-default-long-receiver'
      group_by: ['...']
      group_wait: 30s
      group_interval: 1m
      repeat_interval: 4h
      routes:
      - receiver: 'telegram-short-receiver'
        matchers:
        - message_type = "short"
      - receiver: 'null'
        matchers:
        - alertname =~ ".*Null"
    receivers:
    - name: 'telegram-default-long-receiver'
      telegram_configs:
      - send_resolved: true
        bot_token: 'your_bot_token'
        api_url: 'https://api.telegram.org'
        chat_id: your_chat_id
        parse_mode: 'HTML'
        message: ''
    - name: 'telegram-short-receiver'
      telegram_configs:
      - send_resolved: true
        bot_token: 'your_bot_token'
        api_url: 'https://api.telegram.org'
        chat_id: your_chat_id
        parse_mode: 'HTML'
        message: ''
    - name: 'null'
  templateFiles:
    telegram-default-long-template.tmpl: |-
      # see "telegram-default-long-template.tmpl" file
      # https://github.com/timeforplanb123/timeforplanb123.github.io/blob/master/_posts/telegram-default-long-template.tmpl
      # and copypaste it here
    telegram-short-template.tmpl: |-
      # see "telegram-short-template.tmpl" file
      # https://github.com/timeforplanb123/timeforplanb123.github.io/blob/master/_posts/telegram-short-template.tmpl
      # and copypaste it here
Now, to complete the migration, I need to:
- on k8s cluster machine delete unused objects:
~$ kubectl delete ingress ingress-service ~$ cd k8s ~/k8s$ kubectl delete -f alertmanager ~/k8s$ kubectl delete -f prometheus ~/k8s$ kubectl delete -f snmp-exporter ~/k8s$ kubectl delete -f grafana - on desktop machine rename the
k8sdirectory tomanifestsdirectory(seekubectl applyjob from pipeline), delete unused manifests andpushchanges to remote GitLab repository:# k8s is repository name ~$ cd k8s # rename the "k8s" directory to "manifests" directory ~/k8s$ mv k8s manifests # delete unused manifests ~/k8s$ rm -rf alertmanager prometheus snmp-exporter grafana # push to remote repo ~/k8s$ git add . ~/k8s$ git commit -m "Oh! It's first upgrade to the kube-prometheus-stack!" ~/k8s$ git push origin mainAfter
git pushcommand, myk8srepository looks like this:
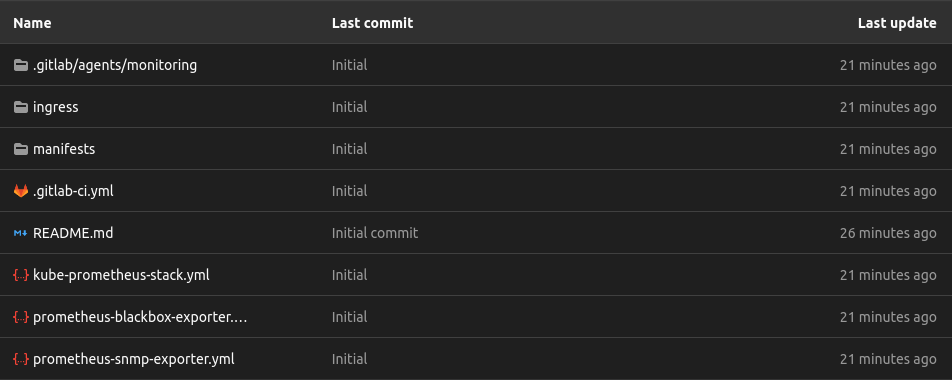
And this is manifests directory:
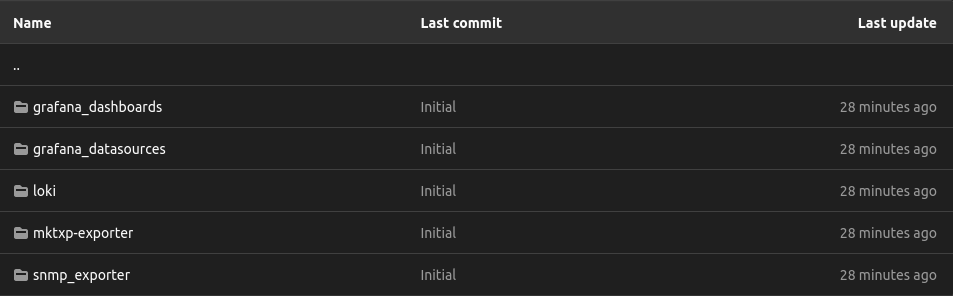
After successful completion of the GitLab pipeline, you can check the status of k8s objects(both using the pipeline report job and manually, using a kubectl commands, on the k8s cluster machine) and the availability of kube-prometheus-stack components (Grafana - http://192.168.49.2/, Prometheus - http://192.168.49.2/prometheus, Alertmanager - http://192.168.49.2/alertmanager).